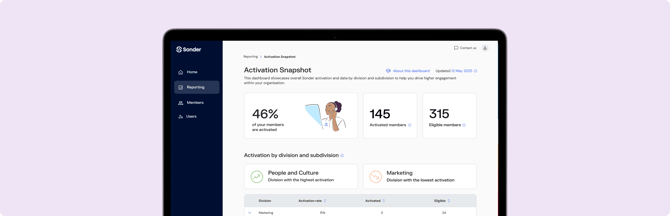
Why is Activation Data Important?
Activation is a critical first step in ensuring you members have access to the human and digital support services that Sonder provides via the Sonder App. By understanding and utilising the data presented on this dashboard, you can gain valuable insights into the health and adoption of the Sonder service across your organisation.
A high activation rate signifies that members are actively engaging with the resources you've provided, which can lead to several positive outcomes:
Early Intervention: By monitoring activation data, you can proactively ensure that all members have the tools they need before a crisis arises. A sub-division with a low activation rate is a group that may be at higher risk of not utilising these preventative resources. Your dashboard provides the data you need to ensure no one is left behind.
Proactive Health & Wellbeing Support: A high activation rate suggests that members are more likely to be aware of and have access to the mental health, medical, and safety support services offered by Sonder. When members feel supported and have easy access to resources, they are better equipped to manage personal challenges that might otherwise lead to absenteeism.
Demonstrate a Commitment to Organisational Wellbeing: When you actively monitor and promote the use of a benefit like Sonder, you are sending a clear message to your members that their wellbeing is a top priority. This commitment is a significant factor in increasing job satisfaction and loyalty. The dashboard provides the data to track the success of these efforts.
Chart Summary
Activation Rate

This chart represents the percentage of activated members divided by the number of eligible members.It is a key metric for measuring the initial uptake and awareness of the Sonder benefit within your company.
Total Activated Members
This figure represents the total number of members that have downloaded the Sonder App and successfully completed the registration process.
Total Eligible Members

This figure represents the total number of members you have provided access to the Sonder service either manually or in bulk via the Sonder Portal or through an API integration. This figure represents your total member base.
Divisions with highest and lowest activation

This chart provides a quick indication of where your engagement efforts are succeeding and where they may need a boost. High activation rates often correlate with strong internal communication and a clear understanding of the value of the Sonder benefit. Low activation rates, on the other hand, can signal a lack of awareness or a communication gap.
Activation by division and subdivision

The ability to see eligible, activated, and activation rates broken down by division and subdivision is important. By clicking the chevron next to a division name, you can see the data for a sub-division (individual teams or departments). This level of detail allows you to pinpoint specific groups that may require targeted communication or a different approach to promoting the benefit.